背景
使用 kubectl logs *** -n *** 看日志太麻烦了,整个平台统一管理集群日志。
什么是 PLG
“PLG”指的是 Promtail、Loki 以及 Grafana 的组合,其中 promtail 收集日志,Loki 储存,Grafana 做可视化。经常用来和“EFK”来做比较,也就是 Elastic Search,FluentD,Kibana 的组合。都是用来做日志管理的
为什么是 PLG
简而言之,EFK 太重了,PLG 更适合云原生环境。
参考:https://www.infracloud.io/blogs/logging-in-kubernetes-efk-vs-plg-stack/
安装步骤
Loki
参考 官方文档,这里选择**monolithic** 这一档的,也就是最朴素的单体架构。并且选择Single Replica。
把 values.yaml 复制过来,保存到本地
 1
 2
 3
 4
 5
 6
 7
 8
 9
10
11
12
13
14
15
16
17
18
19
20
21
22
23
24
25
26
27
28
29
30
31
32
33
34
35
36
37
38
39
40
41
42
43
44
45
46
47
48
49
50
51
52
53
54
55
56
57
58
59
60
61
62
63
|
# https://grafana.com/docs/loki/latest/setup/install/helm/install-monolithic/
loki:
  auth_enabled: false # 修改了这里
  commonConfig:
    replication_factor: 1
  schemaConfig:
    configs:
      - from: "2024-04-01"
        store: tsdb
        object_store: filesystem
        schema: v13
        index:
          prefix: loki_index_
          period: 24h
  storage: # 添加了这里
    type: filesystem
    filesystem:
      chunks_directory: /var/loki/chunks
      rules_directory: /var/loki/rules
      admin_api_directory: /var/loki/admin
      bucketnames: ["loki-bucket"] # <-- Specify at least one bucket name here
  pattern_ingester:
    enabled: true
  limits_config:
    allow_structured_metadata: true
    volume_enabled: true
  ruler:
    enable_api: true

minio:
  enabled: false # 修改了这里

deploymentMode: SingleBinary

singleBinary:
  replicas: 1

# Zero out replica counts of other deployment modes
backend:
  replicas: 0
read:
  replicas: 0
write:
  replicas: 0

ingester:
  replicas: 0
querier:
  replicas: 0
queryFrontend:
  replicas: 0
queryScheduler:
  replicas: 0
distributor:
  replicas: 0
compactor:
  replicas: 0
indexGateway:
  replicas: 0
bloomCompactor:
  replicas: 0
bloomGateway:
  replicas: 0
|
由于我的小鸡资源比较吃紧,所以我关闭了独立的 minio,而是直接使用本地磁盘。
同时还关闭了多租户(Multi-tenancy),这样子就不需要添加“X-Scope-OrgID”,毕竟只有我一个人使用(别问我是怎么知道的)
然后,按照文档执行命令即可
1
2
3
|
helm repo add grafana https://grafana.github.io/helm-charts
helm repo update
helm install loki grafana/loki -f values.yaml -n loki
|
最后得到结果输出
 1
 2
 3
 4
 5
 6
 7
 8
 9
10
11
12
13
14
15
16
17
18
19
20
21
22
23
24
25
26
27
28
29
30
31
32
33
34
35
36
37
38
39
40
41
42
43
44
45
|
NAME: loki
LAST DEPLOYED: Tue Feb 11 18:20:02 2025
NAMESPACE: loki
STATUS: deployed
REVISION: 1
NOTES:
***********************************************************************
 Welcome to Grafana Loki
 Chart version: 6.25.1
 Chart Name: loki
 Loki version: 3.3.2
***********************************************************************

** Please be patient while the chart is being deployed **

Tip:

  Watch the deployment status using the command: kubectl get pods -w --namespace loki

If pods are taking too long to schedule make sure pod affinity can be fulfilled in the current cluster.

***********************************************************************
Installed components:
***********************************************************************
* loki

Loki has been deployed as a single binary.
This means a single pod is handling reads and writes. You can scale that pod vertically by adding more CPU and memory resources.


***********************************************************************
Sending logs to Loki
***********************************************************************

Loki has been configured with a gateway (nginx) to support reads and writes from a single component.

You can send logs from inside the cluster using the cluster DNS:

http://loki-gateway.loki.svc.cluster.local/loki/api/v1/push

You can test to send data from outside the cluster by port-forwarding the gateway to your local machine:

  kubectl port-forward --namespace loki svc/loki-gateway 3100:80 &

And then using http://127.0.0.1:3100/loki/api/v1/push URL as shown below:
|
curl -H “Content-Type: application/json” -XPOST -s “http://127.0.0.1:3100/loki/api/v1/push”
–data-raw “{"streams": [{"stream": {"job": "test"}, "values": [["$(date +%s)000000000", "fizzbuzz"]]}]}”
1
2
|
Then verify that Loki did receive the data using the following command:
|
curl “http://127.0.0.1:3100/loki/api/v1/query_range” –data-urlencode ‘query={job=“test”}’ | jq .data.result
1
2
3
4
5
6
7
8
|
***********************************************************************
Connecting Grafana to Loki
***********************************************************************

If Grafana operates within the cluster, you'll set up a new Loki datasource by utilizing the following URL:

http://loki-gateway.loki.svc.cluster.local/
|
附带开启了多租户的日志
 1
 2
 3
 4
 5
 6
 7
 8
 9
10
11
12
13
14
15
16
17
18
19
20
21
22
23
24
25
26
27
28
29
30
31
32
33
34
35
36
37
38
39
40
41
42
43
44
45
|
NAME: loki
LAST DEPLOYED: Tue Feb 11 17:41:34 2025
NAMESPACE: loki
STATUS: deployed
REVISION: 1
NOTES:
***********************************************************************
 Welcome to Grafana Loki
 Chart version: 6.25.1
 Chart Name: loki
 Loki version: 3.3.2
***********************************************************************

** Please be patient while the chart is being deployed **

Tip:

  Watch the deployment status using the command: kubectl get pods -w --namespace loki

If pods are taking too long to schedule make sure pod affinity can be fulfilled in the current cluster.

***********************************************************************
Installed components:
***********************************************************************
* loki

Loki has been deployed as a single binary.
This means a single pod is handling reads and writes. You can scale that pod vertically by adding more CPU and memory resources.


***********************************************************************
Sending logs to Loki
***********************************************************************

Loki has been configured with a gateway (nginx) to support reads and writes from a single component.

You can send logs from inside the cluster using the cluster DNS:

http://loki-gateway.loki.svc.cluster.local/loki/api/v1/push

You can test to send data from outside the cluster by port-forwarding the gateway to your local machine:

  kubectl port-forward --namespace loki svc/loki-gateway 3100:80 &

And then using http://127.0.0.1:3100/loki/api/v1/push URL as shown below:
|
curl -H “Content-Type: application/json” -XPOST -s “http://127.0.0.1:3100/loki/api/v1/push”
–data-raw “{"streams": [{"stream": {"job": "test"}, "values": [["$(date +%s)000000000", "fizzbuzz"]]}]}”
-H X-Scope-OrgId:foo
1
2
|
Then verify that Loki did receive the data using the following command:
|
curl “http://127.0.0.1:3100/loki/api/v1/query_range” –data-urlencode ‘query={job=“test”}’ -H X-Scope-OrgId:foo | jq .data.result
 1
 2
 3
 4
 5
 6
 7
 8
 9
10
11
12
13
14
15
16
17
18
19
20
21
22
23
24
25
26
27
28
|
***********************************************************************
Connecting Grafana to Loki
***********************************************************************

If Grafana operates within the cluster, you'll set up a new Loki datasource by utilizing the following URL:

http://loki-gateway.loki.svc.cluster.local/

***********************************************************************
Multi-tenancy
***********************************************************************

Loki is configured with auth enabled (multi-tenancy) and expects tenant headers (`X-Scope-OrgID`) to be set for all API calls.

You must configure Grafana's Loki datasource using the `HTTP Headers` section with the `X-Scope-OrgID` to target a specific tenant.
For each tenant, you can create a different datasource.

The agent of your choice must also be configured to propagate this header.
For example, when using Promtail you can use the `tenant` stage. https://grafana.com/docs/loki/latest/send-data/promtail/stages/tenant/

When not provided with the `X-Scope-OrgID` while auth is enabled, Loki will reject reads and writes with a 404 status code `no org id`.

You can also use a reverse proxy, to automatically add the `X-Scope-OrgID` header as suggested by https://grafana.com/docs/loki/latest/operations/authentication/

For more information, read our documentation about multi-tenancy: https://grafana.com/docs/loki/latest/operations/multi-tenancy/

> When using curl you can pass `X-Scope-OrgId` header using `-H X-Scope-OrgId:foo` option, where foo can be replaced with the tenant of your choice.
|
Promtail
继续使用 helm 安装,参考 官方文档
保存 values.yaml 文件
1
2
3
4
5
|
config:
# publish data to loki
  clients:
    - url: http://loki-gateway/loki/api/v1/push
      tenant_id: 1
|
执行命令
1
2
3
4
|
helm repo add grafana https://grafana.github.io/helm-charts
helm repo update
# The default helm configuration deploys promtail as a daemonSet (recommended)
helm upgrade --values values.yaml --install promtail grafana/promtail -n loki
|
得到结果输出
 1
 2
 3
 4
 5
 6
 7
 8
 9
10
11
12
13
14
15
16
17
|
Release "promtail" does not exist. Installing it now.
NAME: promtail
LAST DEPLOYED: Tue Feb 11 18:56:09 2025
NAMESPACE: loki
STATUS: deployed
REVISION: 1
TEST SUITE: None
NOTES:
***********************************************************************
 Welcome to Grafana Promtail
 Chart version: 6.16.6
 Promtail version: 3.0.0
***********************************************************************

Verify the application is working by running these commands:
* kubectl --namespace loki port-forward daemonset/promtail 3101
* curl http://127.0.0.1:3101/metrics
|
Grafana
还是使用 helm 安装,参考 官方文档
保存 values.yaml,开启数据持久化
1
2
|
persistence:
  enabled: true
|
1
|
helm install grafana grafana/grafana -n loki1
|
得到输出
 1
 2
 3
 4
 5
 6
 7
 8
 9
10
11
12
13
14
15
16
17
18
19
20
|
NAME: grafana
LAST DEPLOYED: Tue Feb 11 19:24:11 2025
NAMESPACE: loki
STATUS: deployed
REVISION: 1
NOTES:
1. Get your 'admin' user password by running:

   kubectl get secret --namespace loki grafana -o jsonpath="{.data.admin-password}" | base64 --decode ; echo


2. The Grafana server can be accessed via port 80 on the following DNS name from within your cluster:

   grafana.loki.svc.cluster.local

   Get the Grafana URL to visit by running these commands in the same shell:
     export POD_NAME=$(kubectl get pods --namespace loki -l "app.kubernetes.io/name=grafana,app.kubernetes.io/instance=grafana" -o jsonpath="{.items[0].metadata.name}")
     kubectl --namespace loki port-forward $POD_NAME 3000

3. Login with the password from step 1 and the username: admin
|
我们使用
1
|
kubectl get secret --namespace loki grafana -o jsonpath="{.data.admin-password}" | base64 --decode ; echo
|
获得初始密码
为了从公网直接访问 Grafana 面板,再创建一个 ingress
 1
 2
 3
 4
 5
 6
 7
 8
 9
10
11
12
13
14
15
16
17
18
19
20
21
22
23
|
apiVersion: networking.k8s.io/v1
kind: Ingress
metadata:
  name: grafana
  namespace: loki
  annotations:
    cert-manager.io/issuer: "letsencrypt-prod"
spec:
  tls:
    - hosts:
        - grafana.kl.suyiiyii.top
      secretName: grafana-tls
  rules:
    - host: grafana.kl.suyiiyii.top
      http:
        paths:
          - path: /
            pathType: Prefix
            backend:
              service:
                name: grafana
                port:
                  number: 3000
|
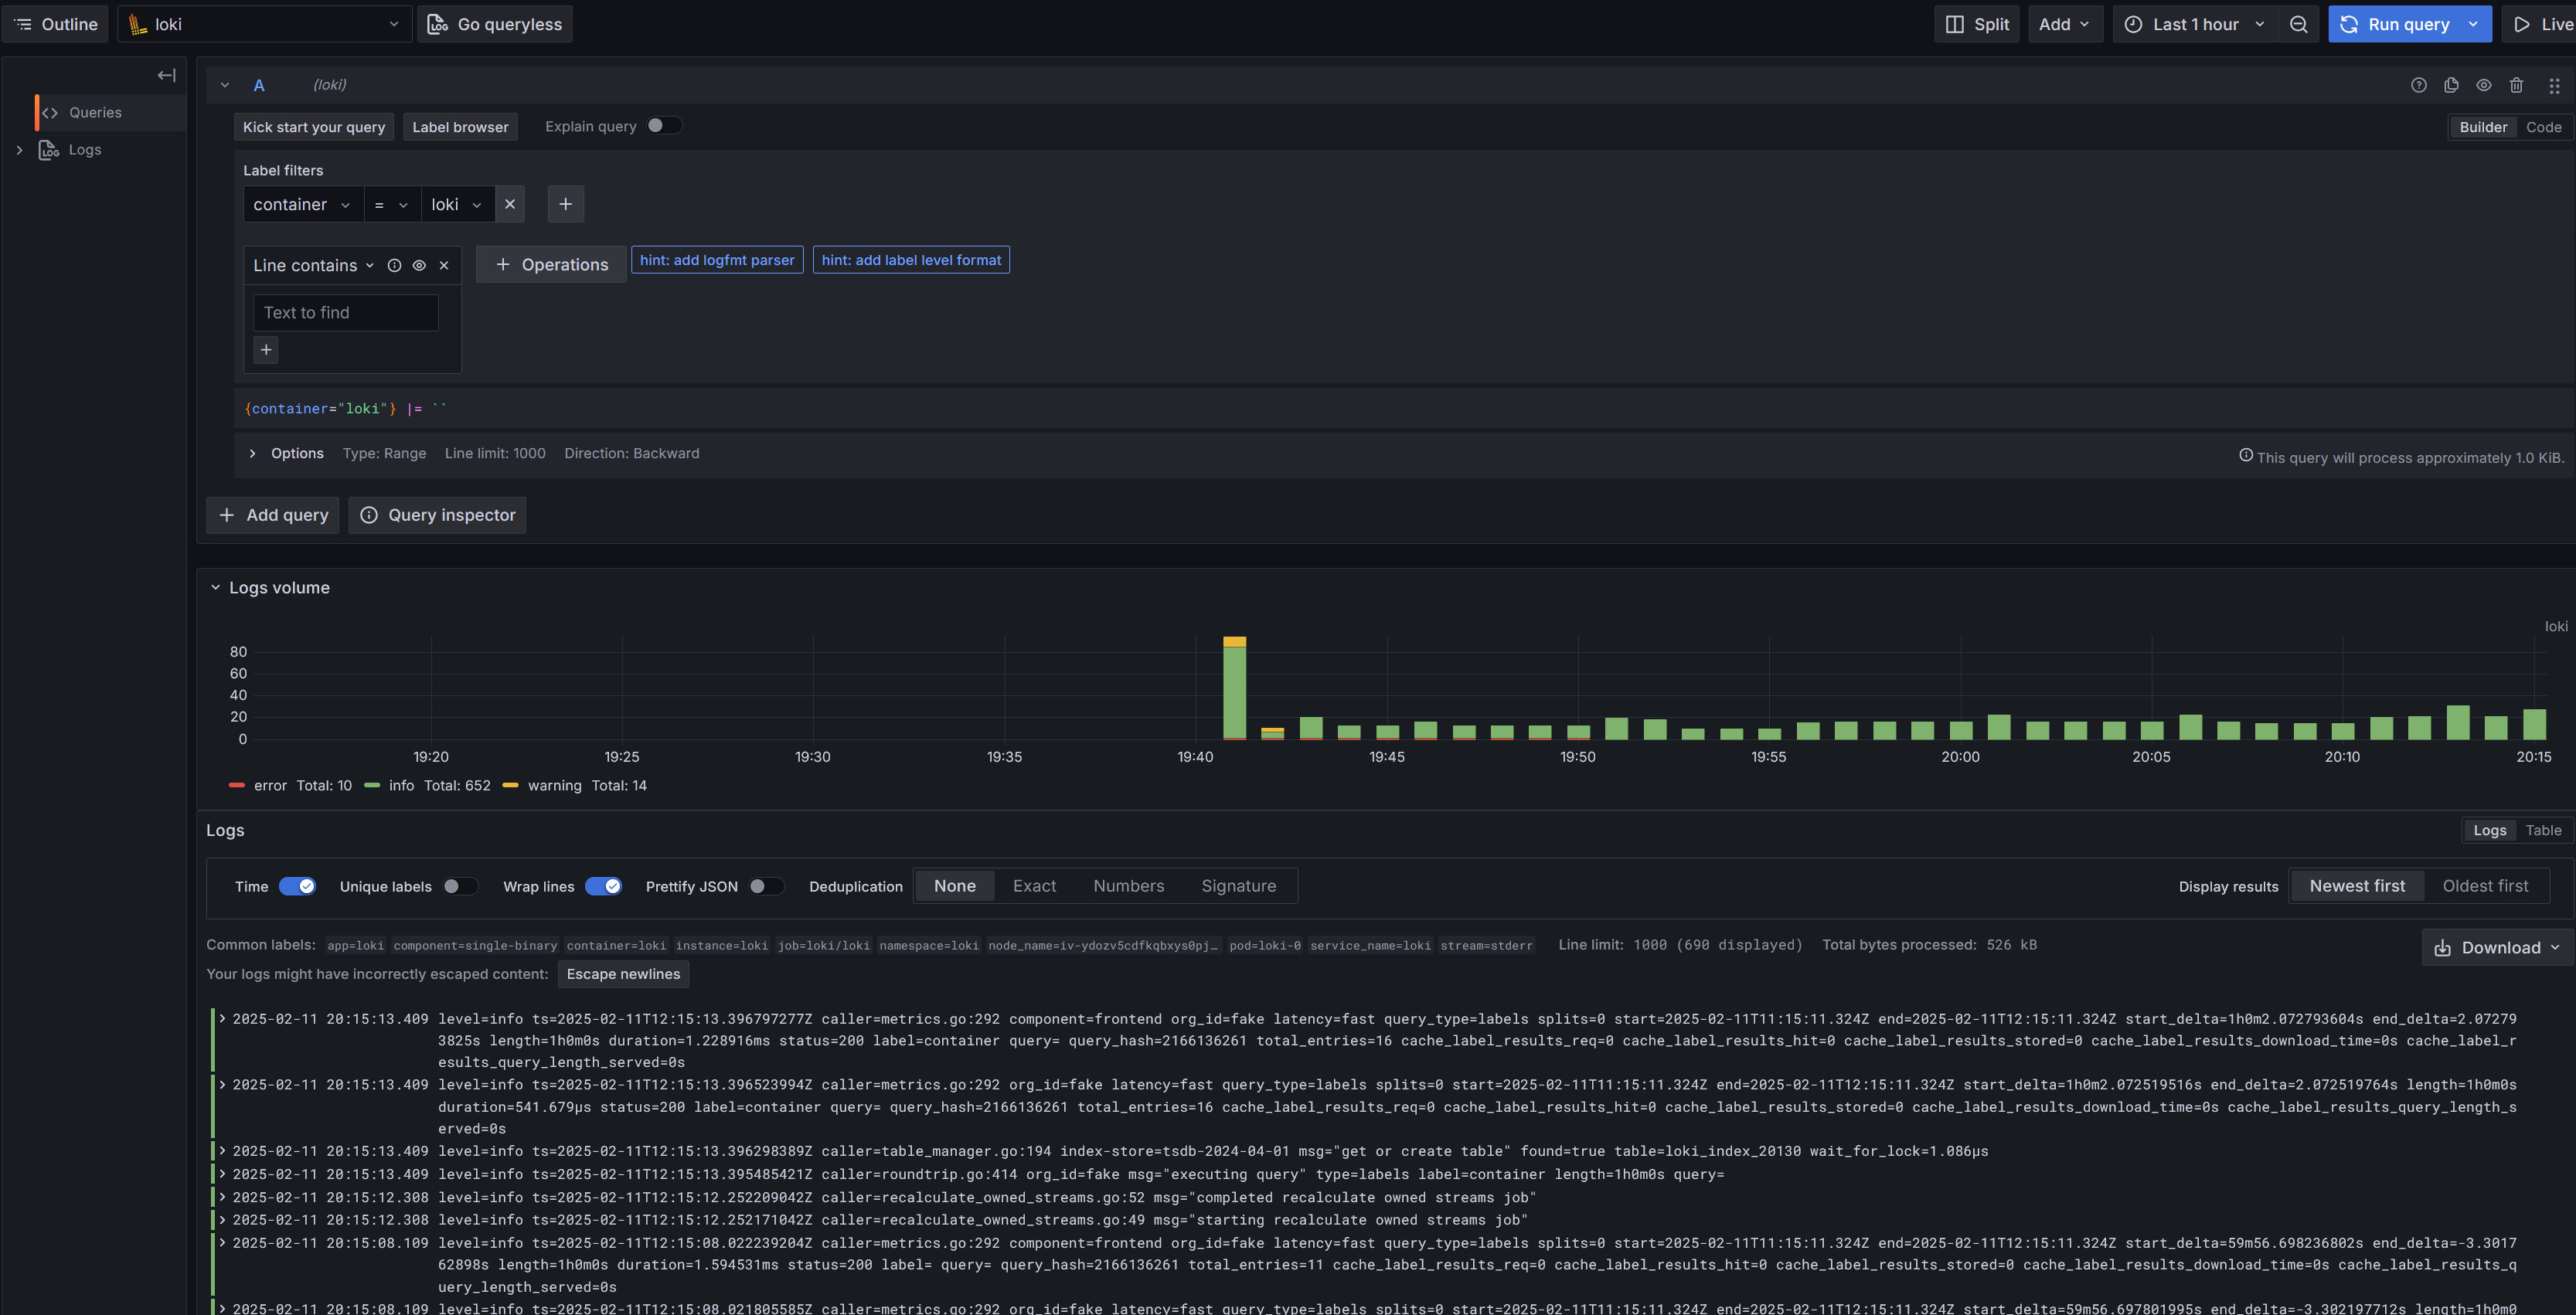
进入之后添加数据源,因为是在同一个 ns 里面,就直接添加 http://loki:3100 就可以了
最后就可以愉快的查询日志啦
总结
也算是折腾吧,相比来说比较简单,不过在配置的时候才过好几次坑。并且运行 helm 的时候需要科学的网络环境。对于配置有什么不懂的可以到 原仓库 找到源文件,然后可以问大模型来快速得到解答。